Analysis Overview
Access
Analysis is available to Admin and Theater users. Box Office users do not have access. Theater users see only productions belonging to their theaters.
Navigation: Admin Menu > Analysis
About Analysis
The Analysis section lets you compare a current show's sales performance against a set of historical productions. Unlike Reports, which export raw data, Analysis provides computed insights, visual comparisons, and revenue projections to help you make decisions about marketing spend, run extensions, and programming.
Analysis Types
Rate of Sales
Compares week-over-week growth in ticket sales and revenue between a current show and a set of historical comparison shows. Includes:
- Daily Average Rate of Sales -- Rolling 7-day revenue for the current show, plotted daily for a high-resolution view of sales momentum
- Rate of Sales Charts -- Week-over-week percentage change in tickets and revenue for the current show, alongside the historical aggregate average
- Performance Insights -- Computed metrics comparing the current show to historical averages (tickets/week, revenue/week, growth trajectory, lifecycle position)
- Revenue Projection -- Two projected cumulative revenue lines through end of run: a Historical-scaled line that applies the current show's performance ratio to a comparison-show lifecycle curve, and a Self-scaled (momentum) line that extends the current show's own recent growth rate forward. Both lines are capped by remaining seat inventory and support modeling run extensions.
See Rate of Sales Analysis for full details.
Ticket Revenue
Analyzes how tickets were distributed across price tiers and how that distribution affected gross revenue. For each price bucket -- a grouping of related ticket classes -- it shows ticket counts, capacity and sold percentages, sell-through rate, actual gross, and (when dynamic pricing is configured) flat-base gross and dynamic lift.
- Price Distribution Charts -- One bar per price bucket, showing its share of total capacity or total paid sales. Comp and Unsold bars fill the remainder.
- Revenue Summary -- Performances, paid tickets, comp tickets, total capacity, capacity utilization, Gross revenue (total cash collected, matching the Production Sales by Performance report), Ticket face value (net of ticketing fees) (derived from the bucket breakdown for pricing analysis), and overall average paid price
- Per-Bucket Detail Table -- Full breakdown by price tier including allocation cap flags (⚑) for buckets that sold to their limit
- Dynamic Pricing Lift -- For productions using dynamic pricing promotion triggers, the revenue earned above the flat entry-price baseline
Unlike Rate of Sales, a historical comparison is optional for Ticket Revenue. You can analyze a single show or compare it side-by-side with one historical production.
See Ticket Revenue Analysis for full details.
Audience
Analyzes who attended a given production: how many are brand-new to your programming, how many have repeat-attended a chosen comparison group of theaters, and how many of your previous shows' audiences have come back for this one. Useful for retention and growth questions and as the precursor to targeted outreach lists.
- Returning-attendee headline counts -- One row per recent prior production in the comparison group (named with the production), plus a catch-all "Returning attendees (any production)" row across all comparison productions ever.
- Per-window metrics -- 3-month, 6-month, 1-year, 3-year, 5-year, and Ever lookback columns for first-time-attendee counts, "Dedicated customers" (attended every comparison-group production whose run overlapped the window), 2+-visit repeats in the comparison group, and 3+-visit repeats in the building. The "Ever" column has no lower bound — it counts against every prior production that ran up to the anchor date.
- Two scopes -- The same metrics are computed against the comparison theater group AND against the entire facility, so you can see both narrow (this company's audience) and wide (any show in the building) retention.
- Ceiling context -- Each section shows how many other productions actually ran in the window, so 0-valued cells are obviously explained by "no shows ran" instead of looking like a bug.
See Audience Analysis for full details.
Direct entry from a production
Audience Analysis has a shortcut button on the admin production page (Productions > [Production Name]) next to Edit and Ticket Classes. Clicking it lands you on the analysis form with that production pre-selected and the default comparison theater seeded -- one more click on Run Analysis and you're done. Rate of Sales and Ticket Revenue don't have this shortcut yet because they need comparison shows you have to pick by hand.
Setting Up an Analysis
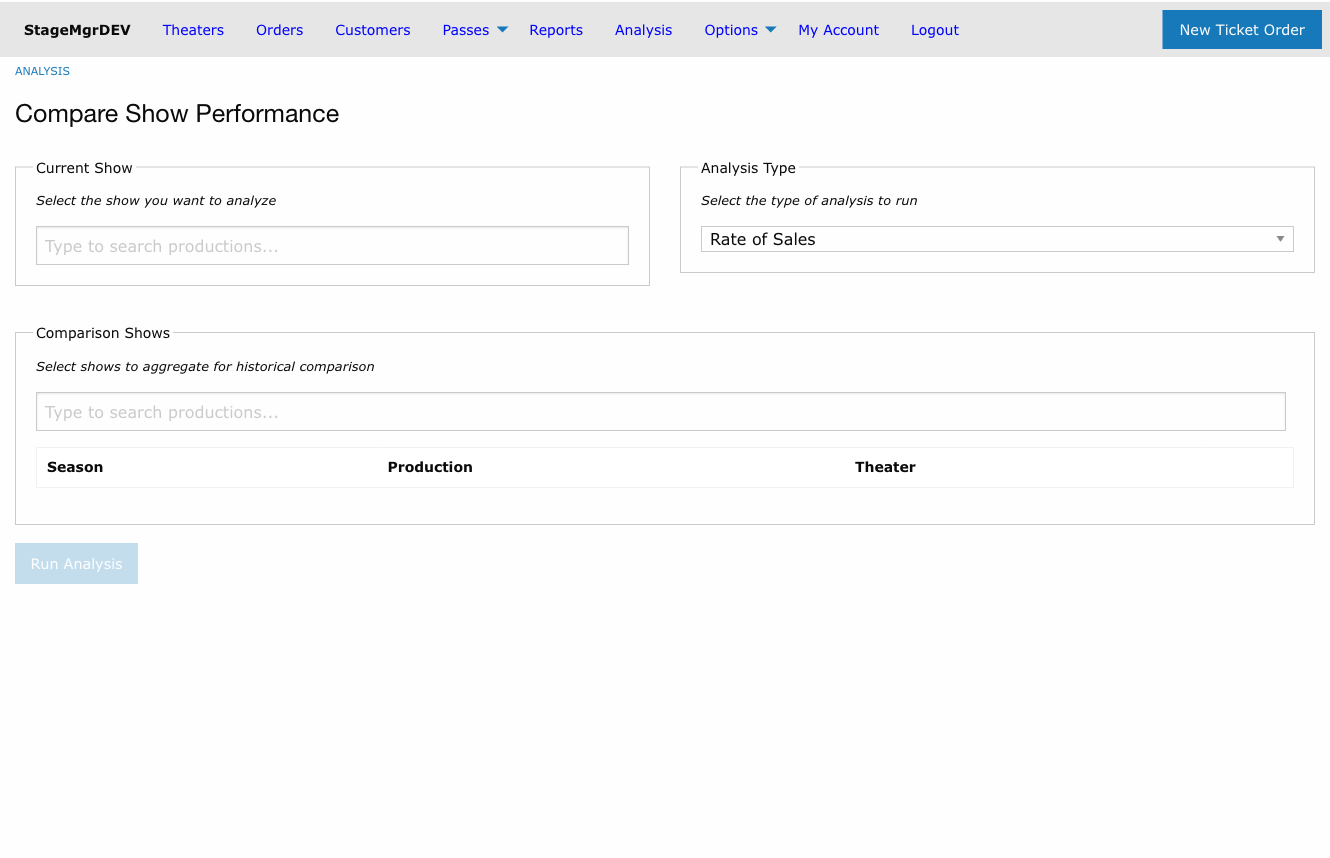
Selecting Analysis Type from the dropdown changes which comparison field is shown:
- Rate of Sales -- Shows a multi-show comparison table. At least one comparison show is required.
- Ticket Revenue -- Shows a single historical production field. No comparison is required; you can run the analysis on a single show.
- Audience -- Shows a comparison-group picker (theaters, not productions). The current production's own theater is seeded by default. You can add more theaters by name or tag. The facility-wide ("vs. every theater in the system") metrics are always shown alongside, so there's no separate "compare against the whole building" toggle.
Rate of Sales
Every Rate of Sales analysis requires two selections:
- Current Show -- The production you want to analyze. Select one show using the autocomplete search field.
- Comparison Shows -- One or more historical productions to aggregate as the baseline. You can add shows individually or use bulk shortcuts.
Ticket Revenue
Ticket Revenue requires only a Current Show. Optionally add one Historical Production to display side-by-side charts and tables. The "Run Analysis" button enables as soon as a current show is selected.
Searching for Productions
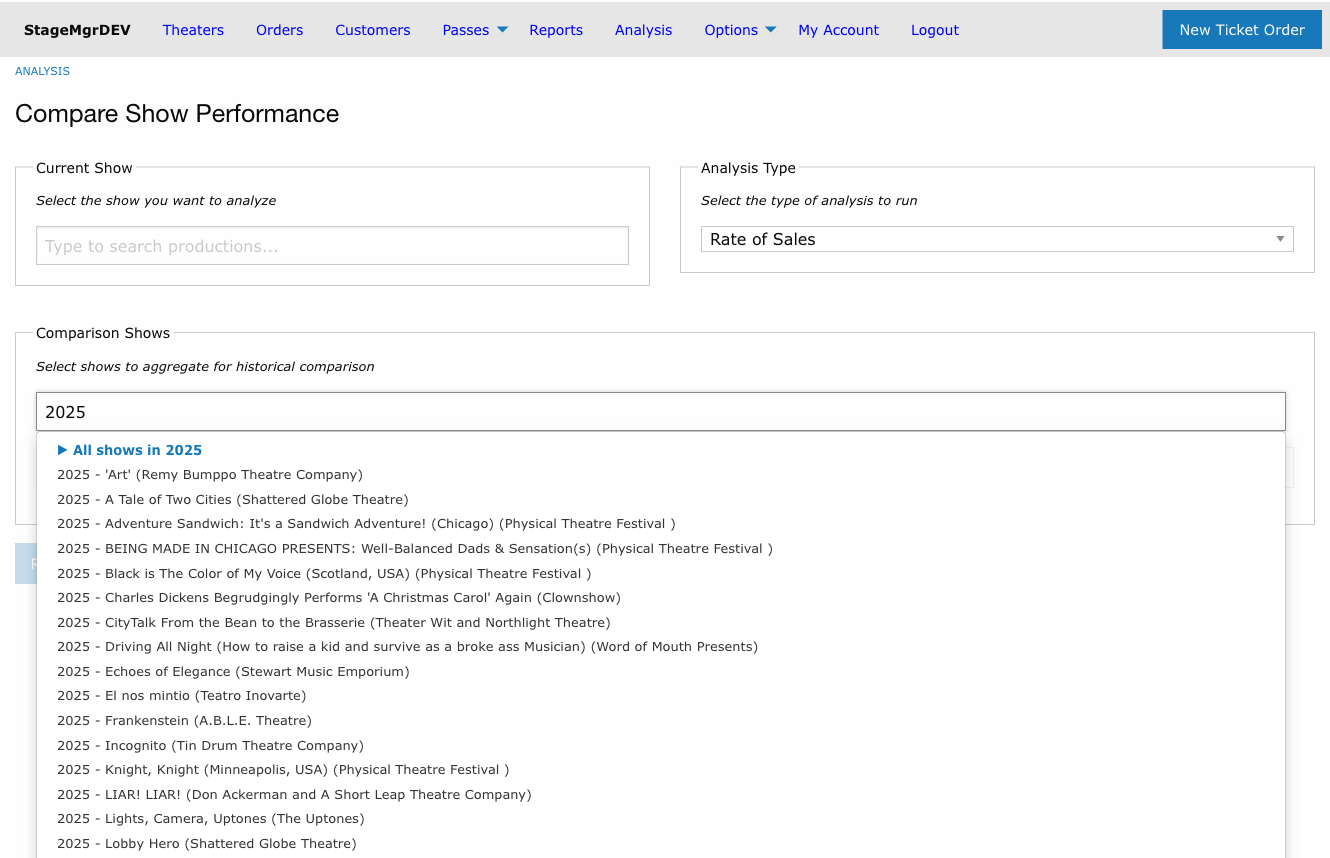
The analysis page uses Stagemgr's shared production picker. Type at least 2 characters in any search field. You can search by:
- Production name
- Season year (e.g., "2025")
- Production code
- Theater name
Productions on Presale status are excluded from search results. All other statuses (Active, Inactive, Private) are available.
Bulk Selection Shortcuts
When adding comparison shows, the autocomplete offers group shortcuts at the top of the results list, shown with a triangle icon:
- All shows in [year] -- Adds every production from that season
- All shows by [company] -- Adds every production by that theater company
- All shows tagged [tag] -- Adds every production whose theater carries that tag. Useful for grouping by neighborhood, genre, partnership type, or any other free-form label you've applied across theaters
Selecting a group shortcut expands it into individual productions in the comparison table. You can then remove any shows you don't want included. Theater users only see groups whose productions belong to a theater they have access to; group shortcuts that would resolve to zero accessible productions don't appear.
In the single-production fields (Current Show and Ticket Revenue's Historical Production), group shortcuts behave differently: selecting one drills down to a list of just that group's productions so you can pick a single show. Use the ← All productions entry to back out of the group.
Managing the Comparison List
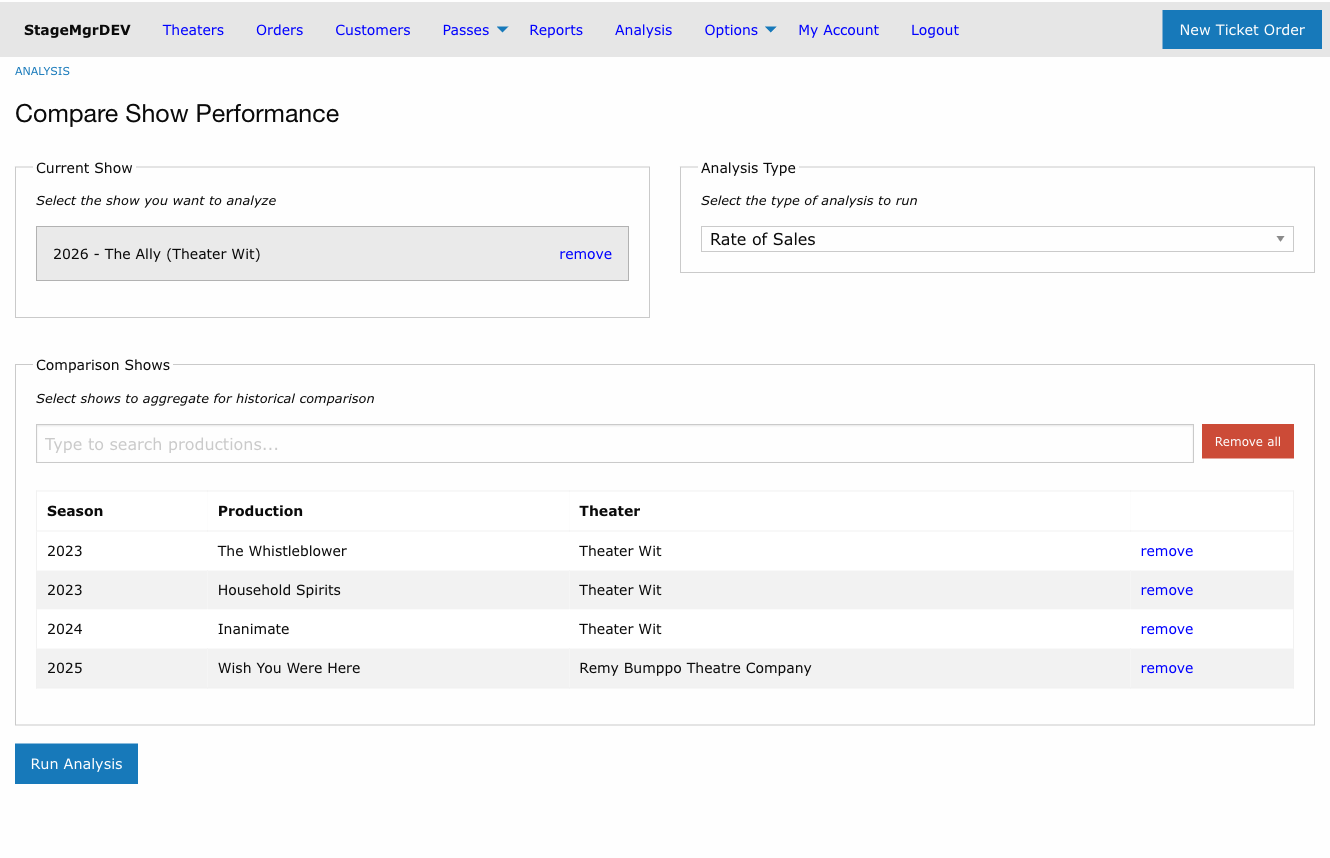
Each comparison show appears in a table with Season, Production, and Theater columns. You can:
- Remove individual shows by clicking "remove" on any row
- Remove all shows by clicking the "Remove all" button (with confirmation)
- Return with selections intact -- The "Back to Analysis" button on the results page preserves your current and comparison selections
Running the Analysis
Once you have the required selections for the chosen analysis type, click Run Analysis to generate results.
Tips
- For meaningful comparisons, select shows with similar characteristics (venue size, genre, audience demographics). A small fringe show compared against a large-venue musical will produce skewed ratios.
- For Rate of Sales, include 3-5 comparison shows when possible. A single comparison show reflects that one show's specific trajectory; multiple shows smooth out anomalies.
- For Ticket Revenue, choose a comparison show from a prior year's run of the same title or a show with similar pricing structure to see whether your current pricing mix is yielding better or worse results.
- Season-based selection ("All shows in 2024") is useful for understanding how this year's programming compares to a prior season overall.
- Theater-based selection ("All shows by Theater Wit") is useful for understanding a company's historical sales pattern.
- Tag-based selection ("All shows tagged Storefront") is useful when you've curated a set of theaters that share an attribute -- venue type, neighborhood, partnership tier -- and want every production from any of them in one click. Apply theater tags to build these groupings.