Ticket Revenue Analysis
Access
Available to Admin and Theater users. Theater users see only their own productions.
Navigation: Analysis > Select show > Run Analysis (Ticket Revenue)
What It Shows
Ticket Revenue analysis answers the question: "How are tickets distributed across price points, and how does our pricing strategy affect total revenue?"
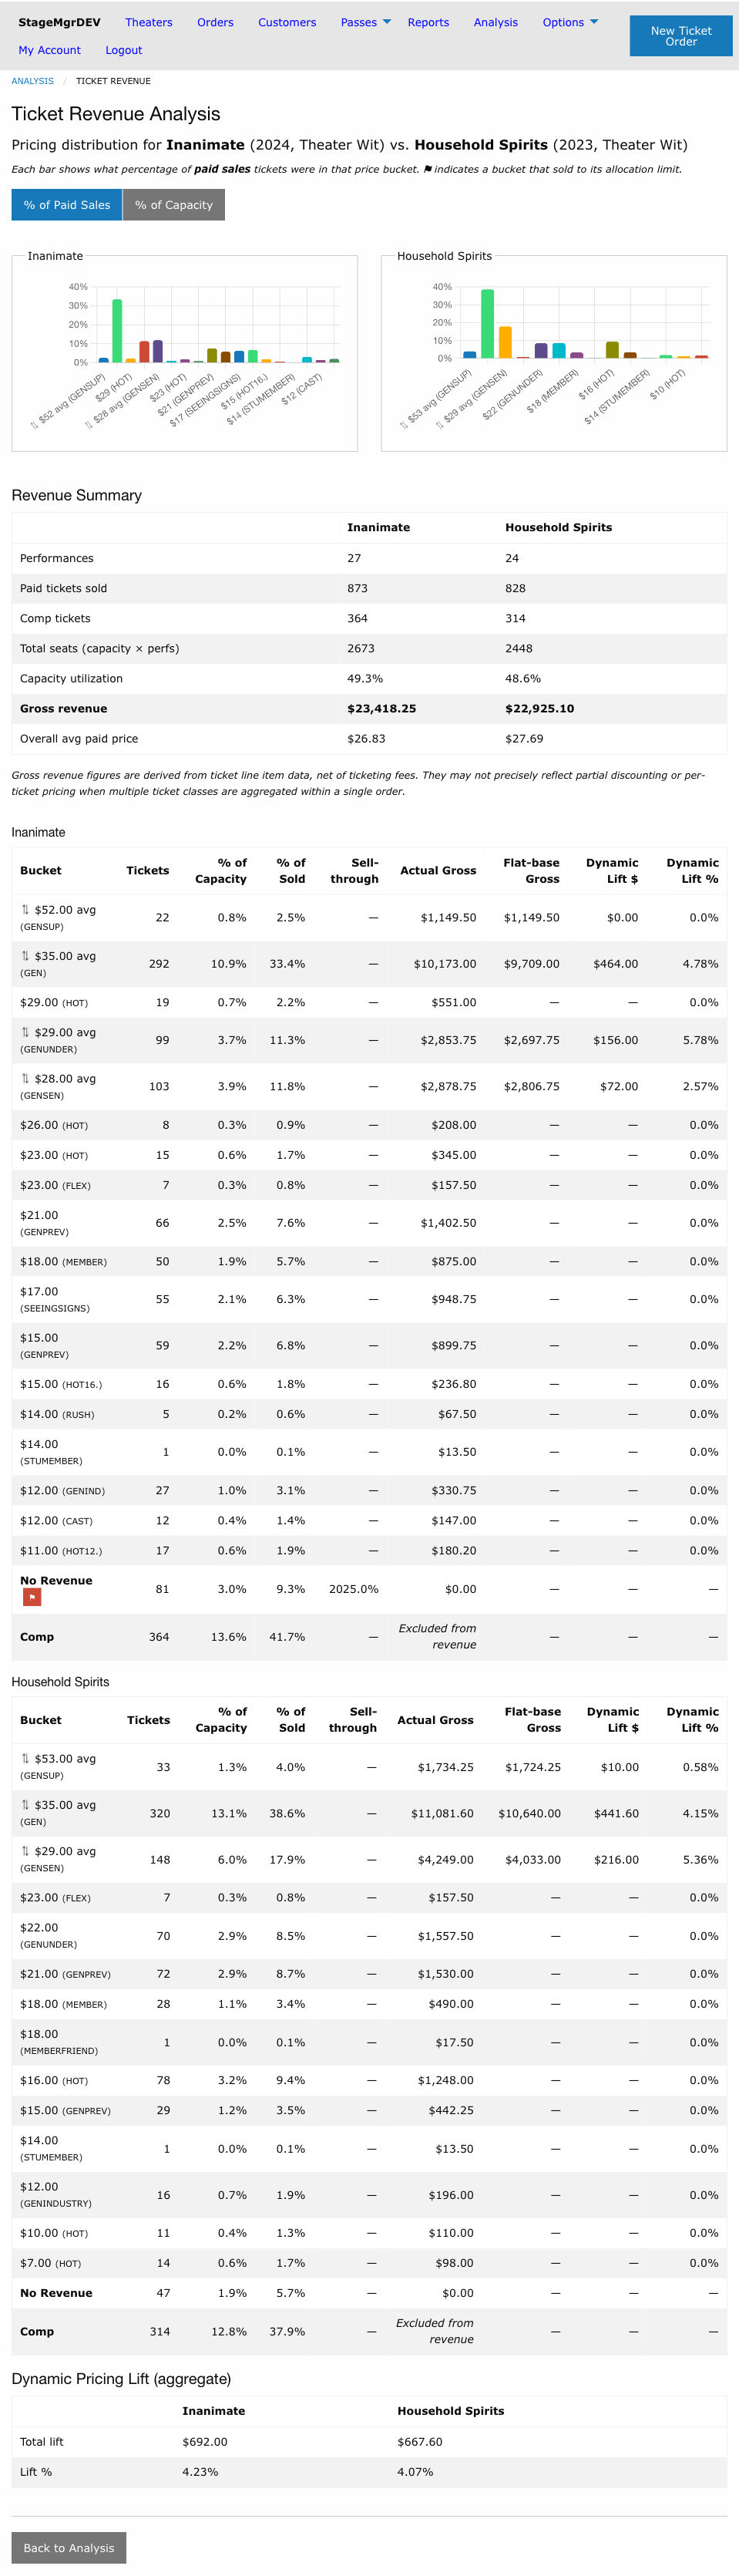
Rather than tracking when tickets were sold, Ticket Revenue focuses on the final state of the run -- what did tickets actually sell for, and how much revenue did each price tier contribute? You can analyze a single show or compare it side-by-side with one historical production.
The analysis page has four sections:
Setting Up the Analysis
Ticket Revenue is selected from the Analysis Type dropdown on the Analysis selection page. Unlike Rate of Sales, a historical comparison production is optional -- you can run the analysis on a single show without selecting a comparison.
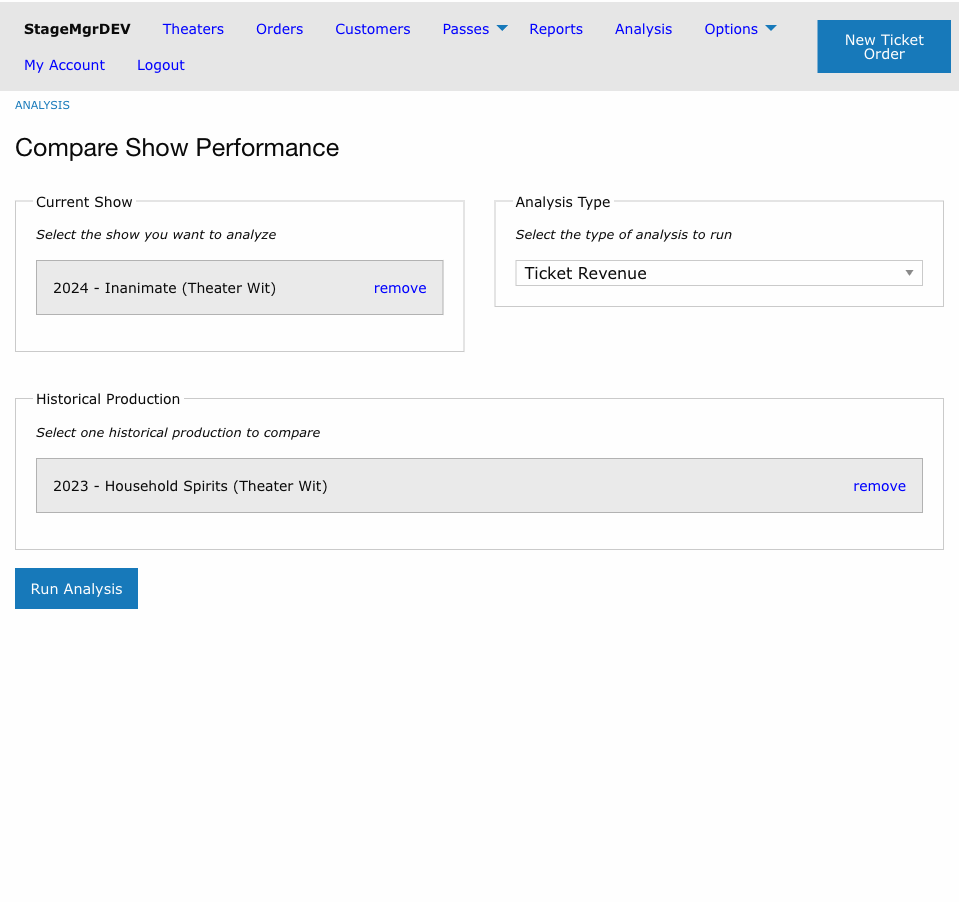
Current Show -- The production you want to analyze. Required.
Historical Production -- A single historical production to compare against. Optional. When selected, charts and tables appear side-by-side for both shows.
Selecting the analysis type changes the comparison field from the multi-show table (used for Rate of Sales) to a single-production search.
Single-show mode
Running the analysis without a comparison production is useful when you want to evaluate your current show's pricing distribution on its own -- for example, to understand how much revenue is coming from discounted tiers vs full price.
Price Distribution Charts
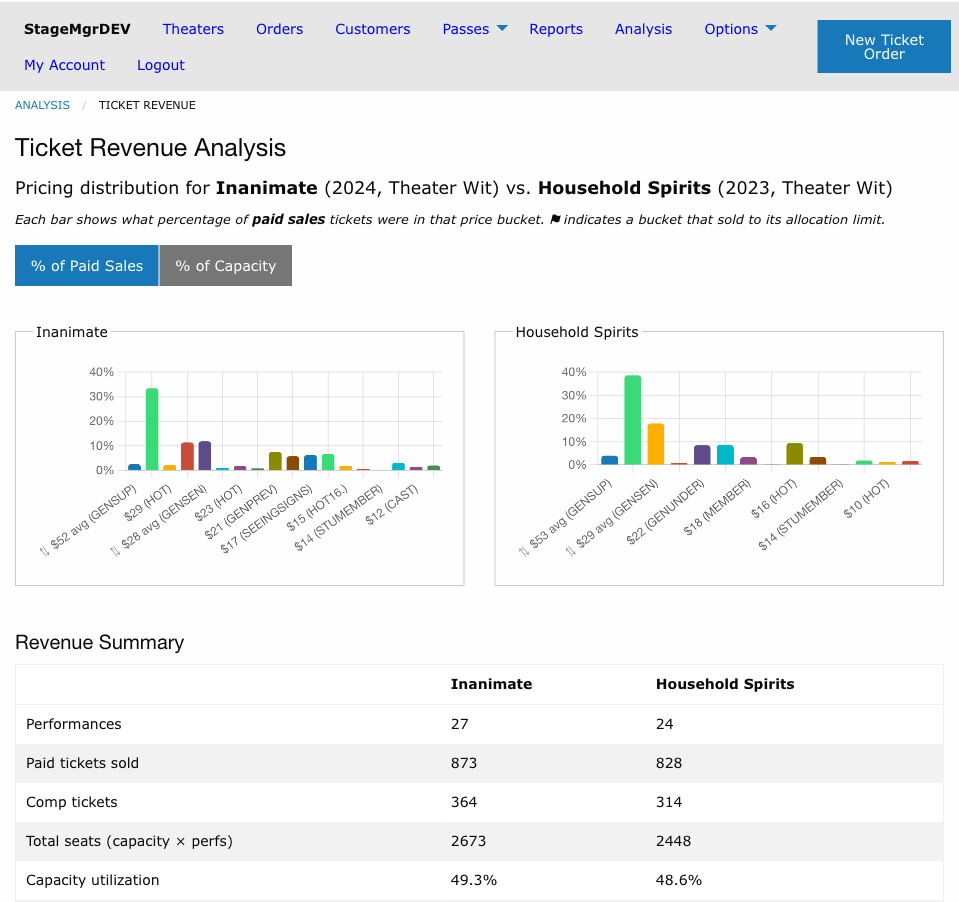
Each chart shows one bar per price bucket -- a grouping of related ticket classes. Bar height represents what percentage of tickets (relative to total capacity or total paid sales) fell into that price tier.
Toggle: % of Paid Sales vs % of Capacity
The % of Paid Sales / % of Capacity buttons control the denominator used for bar heights and apply to both charts simultaneously.
| Mode | Denominator | What it shows |
|---|---|---|
| % of Paid Sales (default) | Total paid tickets sold | The pricing mix among revenue-generating tickets only. Comp and No Revenue buckets are hidden. |
| % of Capacity | Total seats × performances | How each bucket contributed to filling the house, including Comp, No Revenue, and Unsold. |
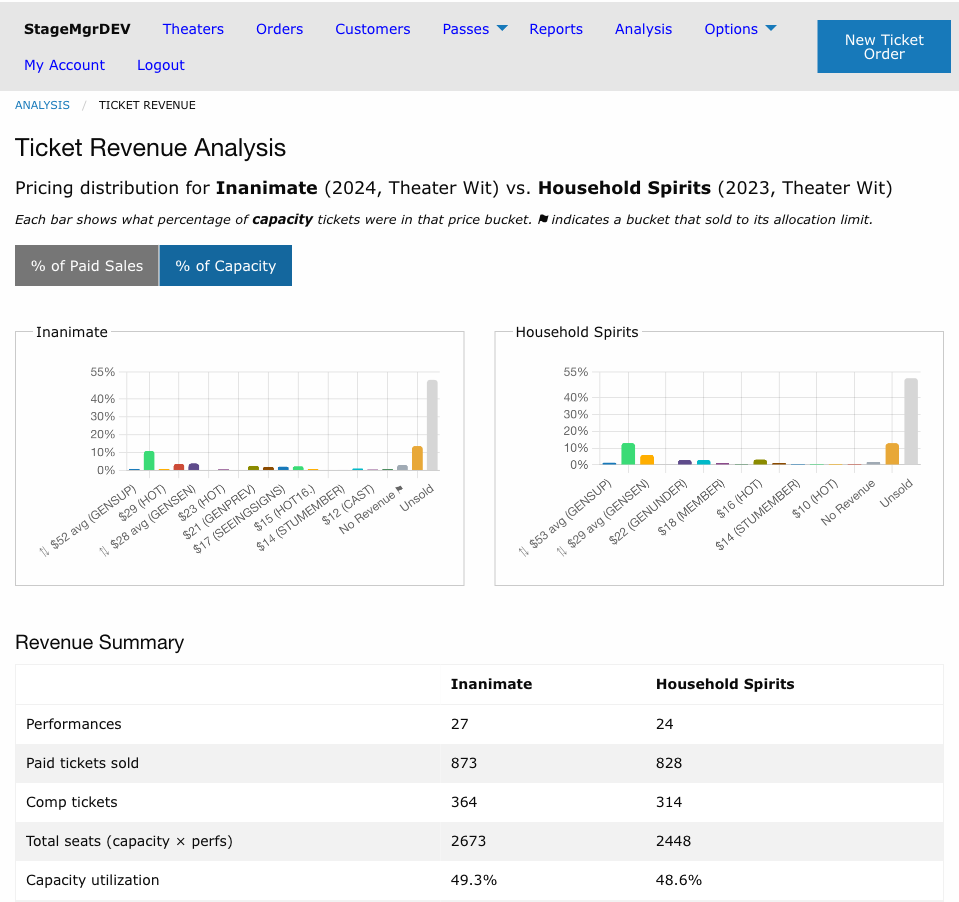
In capacity mode, two additional bars always appear at the right:
- No Revenue -- Tickets from classes with a configured price of $0 that are not flagged as complimentary (e.g. rush passes, staff tickets). Shown in grey-blue.
- Unsold -- Seats that were neither sold nor comped. Shown in light grey.
Allocation Cap Flag
A ⚑ flag on a bucket label indicates that the bucket sold to its allocation limit -- every ticket allocated to that price tier was sold. This is a signal that demand at that price point exceeded supply; more tickets could likely have been sold at that price.
In-Progress Shows
When a production is still running, a warning banner appears below the chart:
Run in progress -- N of M performances complete.
This reminds you that the revenue picture is incomplete. Either show can be in progress, and each banner appears independently under its own chart.
How to Read the Chart
- Tall bars at high price points -- Strong uptake at premium prices. If those bars also have ⚑ flags, you may have underpriced or under-allocated that tier.
- Tall bars at discounted prices -- A significant share of revenue came from discounted tickets. Compare to your comparison show to see if this pattern differs.
- Large Unsold bar -- Low overall capacity utilization. Combined with small bars at higher price points, this may suggest pricing was too high for the demand level.
- Large Comp or No Revenue bar -- A significant portion of seats were issued without generating revenue. Comp tickets are intentional; a large No Revenue bar may indicate free-ticket classes that were not configured as complimentary.
Revenue Summary
Scroll below the charts to see a summary table comparing both shows side-by-side.
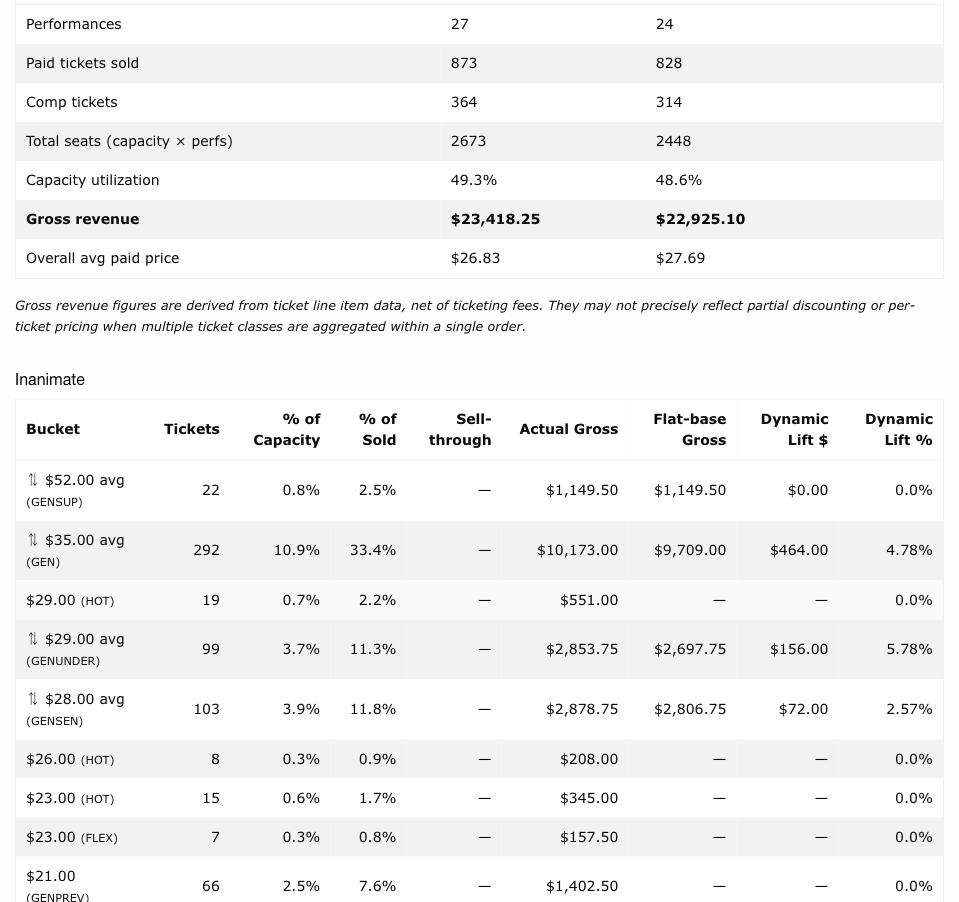
| Row | Description |
|---|---|
| Performances | Total number of scheduled performances |
| Paid tickets sold | Tickets sold through paid orders at a positive price (excludes Comp and No Revenue) |
| Comp tickets | Total complimentary tickets issued |
| Total seats (capacity × perfs) | Venue capacity multiplied by number of performances -- total available seat-slots |
| Capacity utilization | (Paid + Comp + No Revenue) ÷ Total seats, as a percentage |
| Gross revenue | Total cash collected across every settled order for this production (credit card, cash, membership, flex pass, and any other payment type), netted against refund and exchange offsets. This figure matches the gross column of the Production Sales By Performance report. |
| Ticket face value (net of ticketing fees) | Sum of the ticket line items in the bucket breakdown below, minus the per-ticket ticketing fee. Processing fees and non-ticket items are excluded; refunded and exchanged orders are not included. Customer-facing special offer discounts are reported separately below and are not subtracted here. Use this to reason about pricing distribution, not cash flow. |
| Overall avg paid price | Ticket face value ÷ paid tickets sold |
Ticket Sales by Zone
For productions on a seat map with two or more seat zones, a heatmap appears below the Revenue Summary showing how each zone is selling relative to the others. Each seat is colored by its zone's percentage of stock sold -- the deepest red marks the production's best-selling zone, and paler zones are selling relatively slower. Zone labels on the map and a table below it give the exact figures.
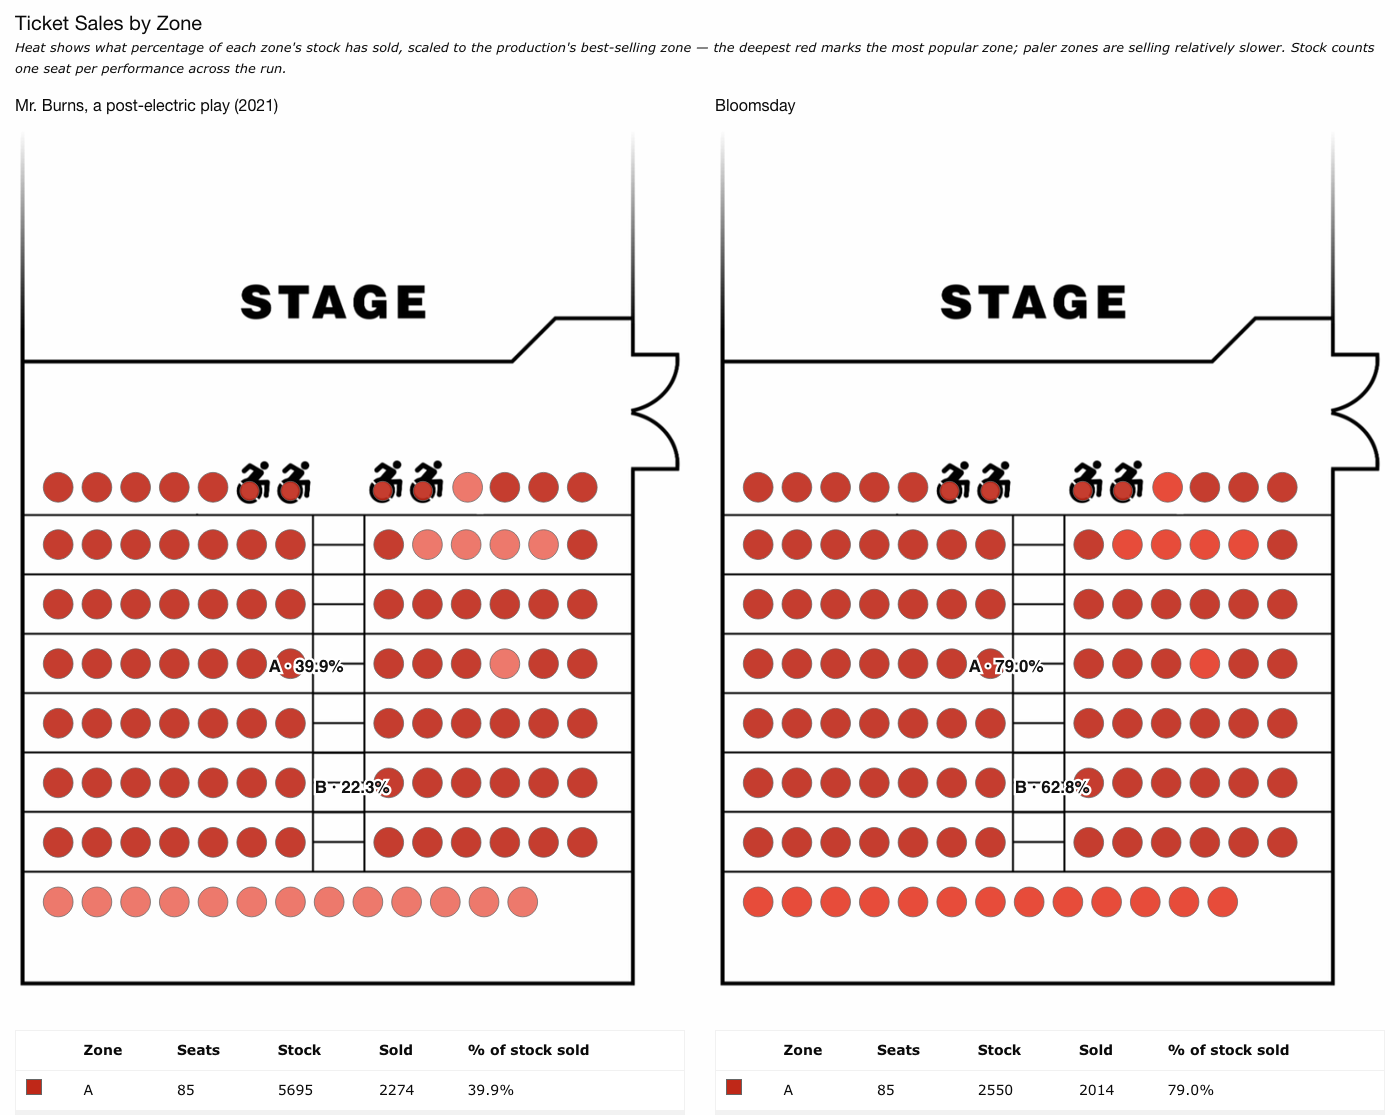
| Column | Description |
|---|---|
| Zone | The seat zone, as painted in the seat map editor |
| Seats | Number of seats currently in the zone |
| Stock | The zone's total inventory across the run -- one per seat per performance. Seats marked broken/N/A are excluded, and seats added mid-run only count for the performances that actually offered them. |
| Sold | Seats in the zone sold across all performances |
| % of stock sold | Sold ÷ Stock |
Reading the heat
Color intensity is scaled within each production (its best-selling zone is always the deepest red), so the heatmap answers "which of my zones is more popular?" -- compare the percentage figures, not the colors, when judging one production against another.
The section is hidden for general admission productions and for seat maps where every seat is in the same zone. Held seats count toward stock but not toward sold.
Per-Bucket Detail Table
Below the summary, a separate detail table is rendered for each show, listing every price bucket with full metrics.
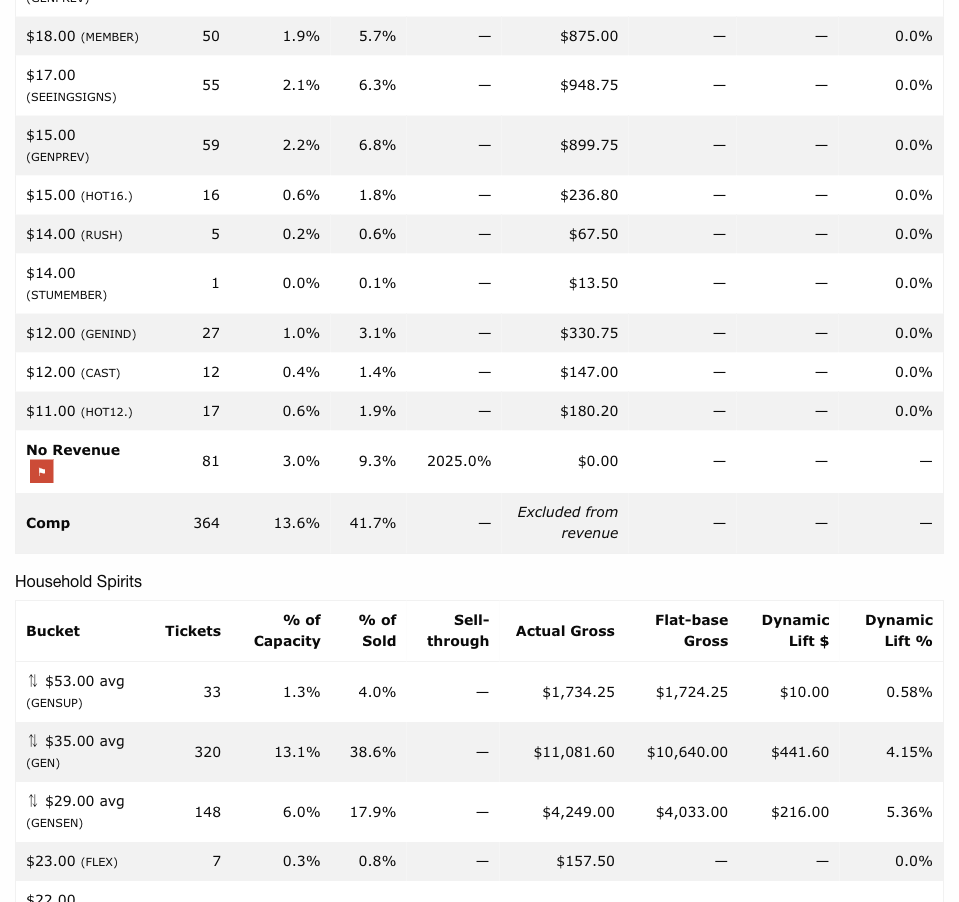
| Column | Description |
|---|---|
| Bucket | Price label, ticket class code label, and ⚑ flag if allocation limit was reached |
| Tickets | Total tickets sold in this bucket |
| % of Capacity | Bucket tickets ÷ total capacity |
| % of Sold | Bucket tickets ÷ total paid tickets sold |
| Sell-through | Bucket tickets ÷ bucket allocation. Only shown when explicit ticket limits are set on the allocations; displays — otherwise |
| Actual Gross | Total revenue from this bucket at the prices actually charged, net of ticketing fees |
| Flat-base Gross | (Dynamic buckets only) -- What gross would have been if all tickets sold at the lowest price in the bucket |
| Dynamic Lift $ | (Dynamic buckets only) -- Actual Gross minus Flat-base Gross |
| Dynamic Lift % | (Dynamic buckets only) -- Lift as a percentage of Flat-base Gross |
The Comp and No Revenue rows appear at the bottom of each table with muted styling. Comp tickets show "Excluded from revenue" in the Actual Gross column. No Revenue tickets show $0.00.
Bucket Labels
How a bucket is labeled depends on its type:
- ⇅ $52 avg (GEN) -- A dynamic pricing bucket. The ⇅ symbol indicates that Stagemgr's dynamic pricing can shift tickets between price classes in this group. The dollar amount is the demand-weighted average paid price; "avg" appears because multiple price points exist within the bucket.
- $29 (HOT) -- A singleton bucket: one ticket class with no promotion links. The dollar amount is the single price for this class; "avg" is omitted because there is only one configured price.
- Comp -- All complimentary ticket classes combined into one row.
- No Revenue -- All non-comp ticket classes with a configured price of $0 combined into one row.
The subtitle in parentheses is derived from the ticket class codes:
- If all class codes share a common prefix (e.g.,
GEN35,GEN40,GEN44→ GEN), the shared prefix is shown. - If there is no common prefix, the price range is shown instead (e.g., $17--$20).
Dynamic Pricing Lift
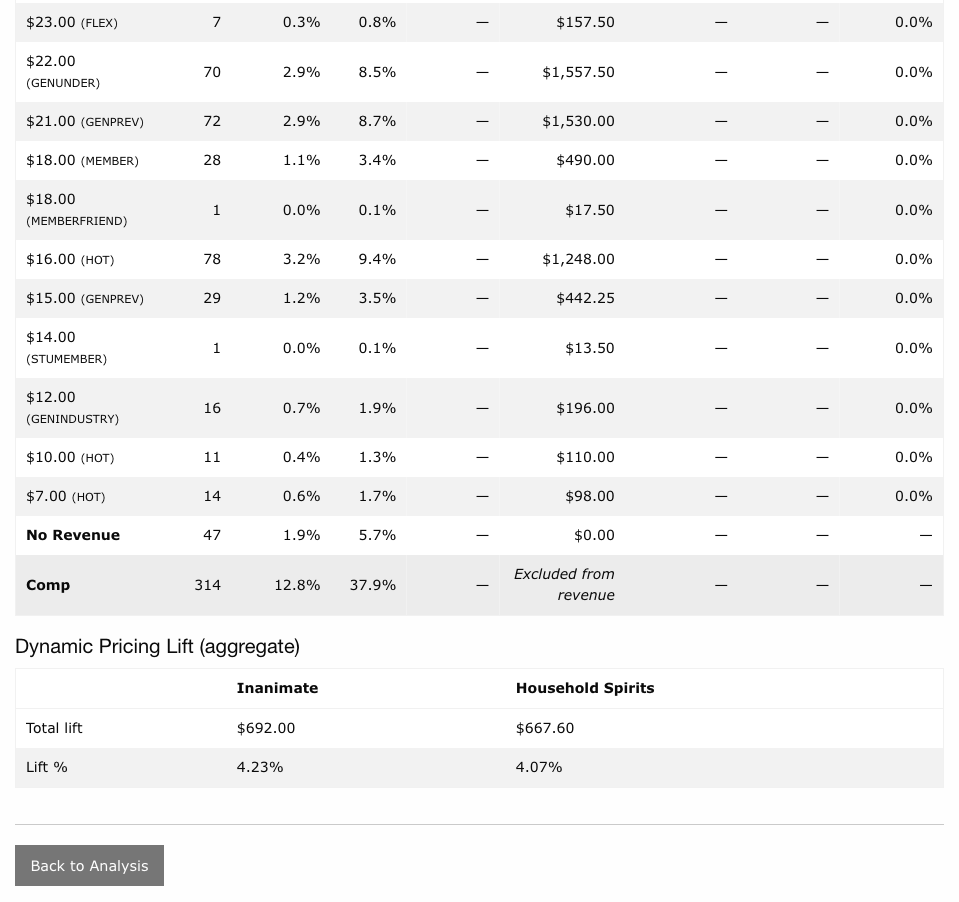
When any bucket contains multiple linked ticket classes (a dynamic pricing bucket), additional columns appear in the bucket detail table and a Dynamic Pricing Lift (aggregate) rollup table appears at the bottom of the page.
How Dynamic Buckets Work
Dynamic pricing in Stagemgr works by defining promotion triggers on ticket class allocations: when a ticket class fills past a time or capacity threshold, available inventory shifts to a higher-priced class. Ticket Revenue Analysis traces these promotion links and groups all connected classes into a single bucket, marked with ⇅.
For a dynamic bucket:
- Floor price is the lowest configured price (net of ticketing fees) across all classes in the bucket
- Flat-base Gross is what revenue would have been if every ticket sold at the floor price
- Dynamic Lift $ is the additional revenue earned because some tickets sold at higher promoted prices
- Dynamic Lift % is the lift as a fraction of the flat-base
Lift and the floor price
Both Flat-base Gross and Actual Gross are calculated net of ticketing fees, so the comparison is consistent. A dynamic lift of $0 means all tickets in the bucket happened to sell at the lowest configured price, even if promotion triggers were active.
Aggregate Lift Table
| Row | Description |
|---|---|
| Total lift | Sum of Dynamic Lift $ across all dynamic buckets |
| Lift % | Total lift ÷ total flat-base gross across dynamic buckets |
A positive lift percentage means dynamic pricing generated more revenue than a flat pricing strategy would have. A zero lift means all tickets sold at the floor price even though promotion triggers were configured.
Special Offer Usage
Between the bucket detail tables and the dynamic pricing section, a Special Offer Usage table lists every special offer code that was applied to finalized orders for the production. The table renders once per show when comparing two productions.
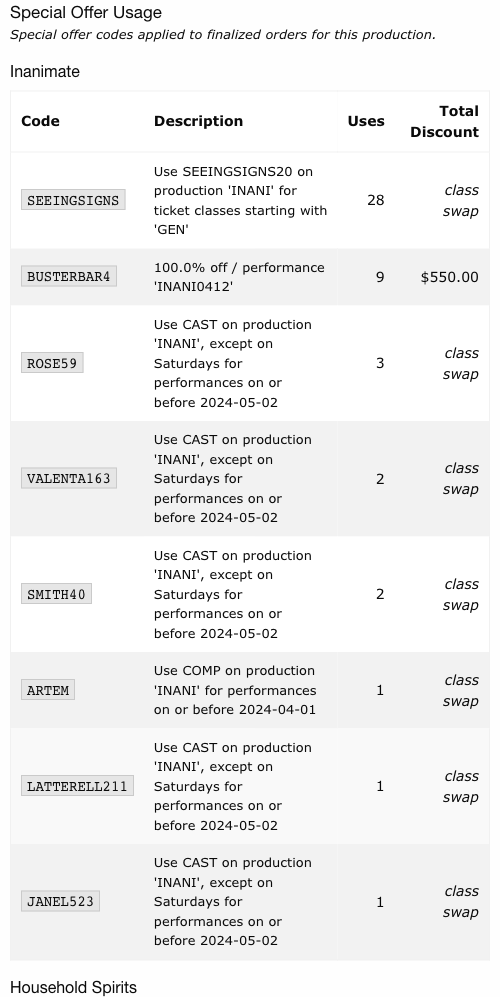
| Column | Description |
|---|---|
| Code | The offer code customers entered at checkout |
| Description | Human-readable description generated from the offer's rules (theater/production/performance scope, ticket class filter, day restrictions, date range) |
| Uses | Number of finalized orders that applied the code |
| Total Discount | Sum of discount amounts applied through this offer. Shows class swap for ticket-class offers where the discount is realized by reassigning the ticket to a different class rather than as a dollar-value line item. |
Rows are sorted by number of uses, descending.
Dynamic Bucket Breakdown
Below the aggregate lift table, a per-bucket breakdown shows the mix of ticket classes inside each dynamic pricing bucket. This lets you see exactly how tickets distributed across the tiers in the promotion chain.
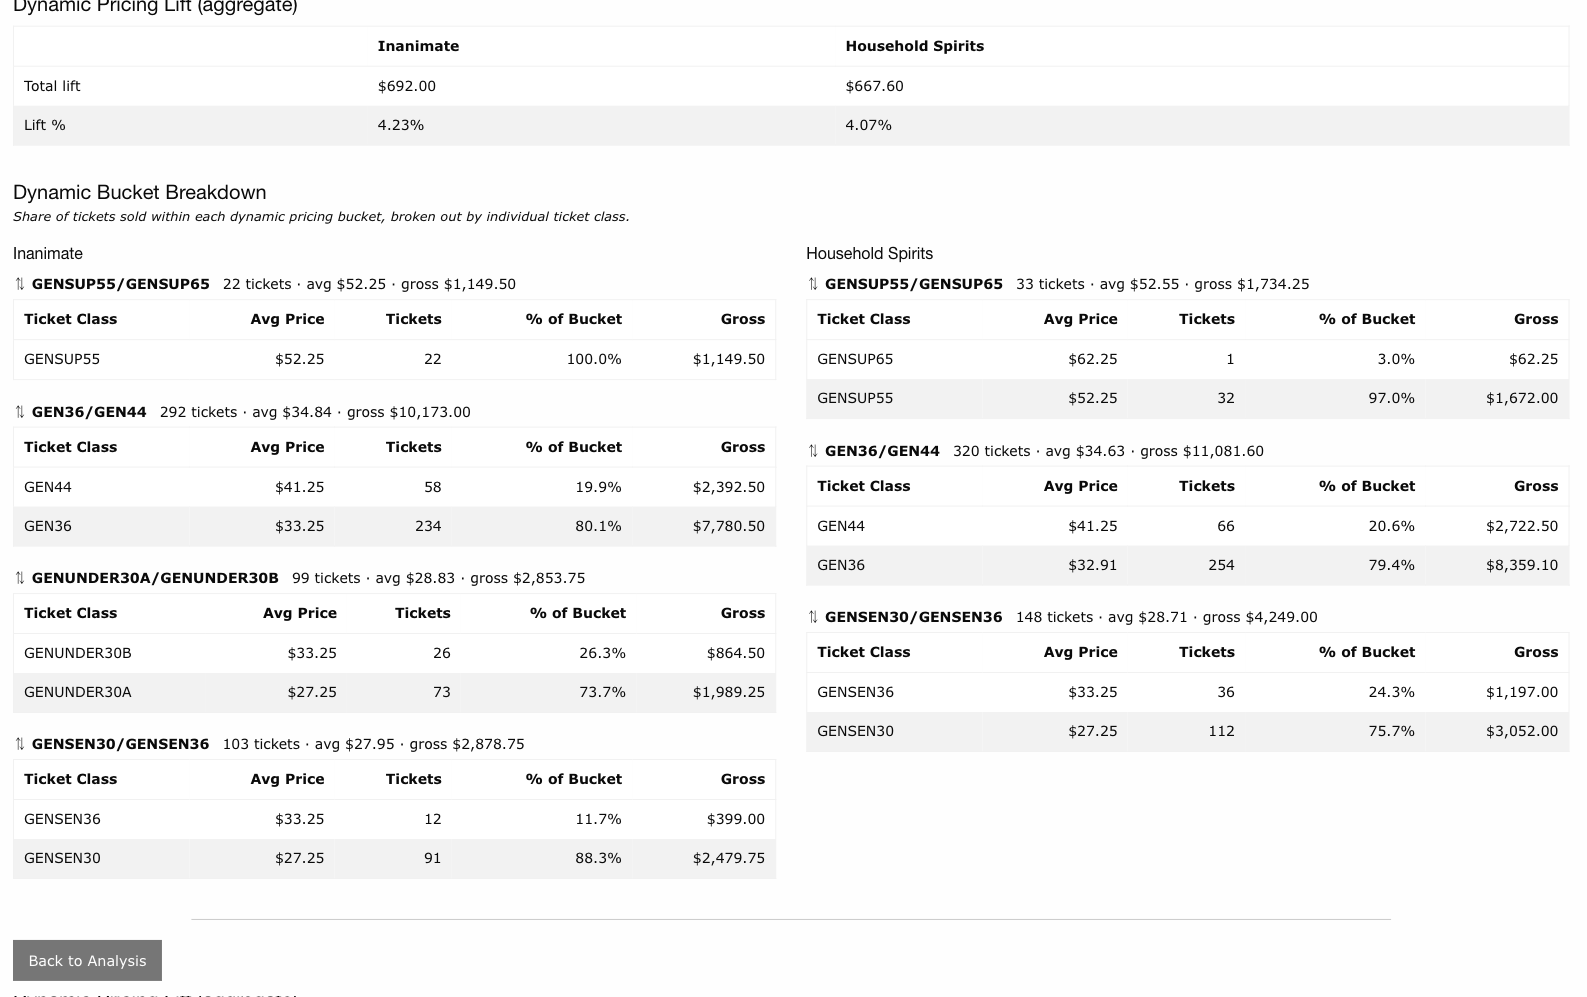
For each dynamic bucket (one table per bucket, per show):
| Column | Description |
|---|---|
| Ticket Class | The class code (e.g. GEN36, GEN40, GEN44) |
| Avg Price | Demand-weighted average price actually paid for tickets in this class, net of fees |
| Tickets | Tickets sold in this class |
| % of Bucket | This class's share of total tickets in the bucket |
| Gross | Net revenue from this class, net of ticketing fees |
Classes are sorted from highest to lowest average price. The header above each table shows the bucket total (tickets, average price, and gross) for quick comparison.
Reading the breakdown
A dynamic bucket where most tickets landed in the lowest-priced class means promotions rarely triggered -- either demand never hit capacity thresholds, or the time-based triggers fired late. A bucket where most tickets landed in the highest-priced class means early tiers filled quickly and patrons paid premium prices for most of the run.
Using Lift to Tune Dynamic Pricing
If lift is very low (near 0%), check whether promotion triggers are set too aggressively (thresholds never reached) or too conservatively (shifted too late in the run to affect many tickets). If lift is high and ⚑ flags appear on the promoted buckets, consider whether your allocation limits are leaving revenue on the table.
Price Buckets Explained
Buckets are determined automatically from the production's ticket class configuration. There are four bucket types, applied in order of precedence:
| Bucket type | Symbol | Criteria |
|---|---|---|
| Dynamic | ⇅ | Ticket class appears in any promotion link (as source or destination) in any allocation for this production. All transitively connected classes share one bucket. |
| Singleton | (none) | Ticket class has no promotion links in any allocation. Each class is its own bucket. |
| No Revenue | (none) | Non-complimentary class with a configured price of $0 or less and no promotion links. All such classes are collapsed into one bucket. |
| Comp | (none) | Ticket class is flagged complimentary. All comp classes share one bucket, always shown last. |
When a class participates in promotion links in some performances but appears alone in others, it is always treated as dynamic (the presence of any promotion link takes precedence).
Revenue is net of ticketing fees
All gross revenue figures have ticketing fees (per-ticket facility fees configured on each ticket class) deducted. The figures represent net revenue to the production, not the total amount charged to patrons.
Revenue includes royalty-priced tickets
Some ticket classes have a list price of $0 but a non-zero royalty amount. These tickets contribute revenue at the royalty amount for bucket assignment and gross revenue calculation.
Refunded tickets excluded
Revenue figures reflect the final settled state of all orders. Tickets from refunded or canceled orders are not counted. Exchange orders are counted in the replacement ticket's bucket.